
Capitalising on a rapidly changing energy and carbon landscape
ŌĆ£Put a big, fat price on carbon!ŌĆØ
These were some of the final words of the outgoing Secretary-General of the OECD Mr ├üngel Gurr├Ła, in his final address in February 2021.
This coincided with the passing of a resolution for a WTO-compatible EU carbon border adjustment mechanism (CBAM) in February 2021. This resolution aims to present a proposal in the second quarter of 2021 with implementation by no later than 2023. This CBAM is likely to be applied to Australian imports into the EU with a potential carbon price equivalent to existing EU carbon pricing of A$60/TCO2-e.
Mainsheet Capital believes many Australian businesses are unprepared for the impacts of such a carbon price or to capitalise on the opportunities it presents.
It also highlights the necessity for businesses to consider global trends and movements in the emissions landscape beyond Australian policy.
Inefficient investments to lower energy costs and reduce emissions
In a fast-changing landscape we observe businesses rushing to commit funds to activities designed to increase renewable energy and reduce emissions without correctly understanding the effectiveness or opportunity cost of these decisions.
We particularly note the added complications of rapidly changing energy policies, reporting mechanisms, growth of renewable energy penetration, changing emissions intensity factors and the deflationary nature of technologies. Overall, these present challenges to correctly model:
- The
most cost-effective method to increase renewable energy and reduce emissions; - Impacts
on actual emissions and reported emissions; and - Optimal
timing for implementation.
Performance of key Australian grids
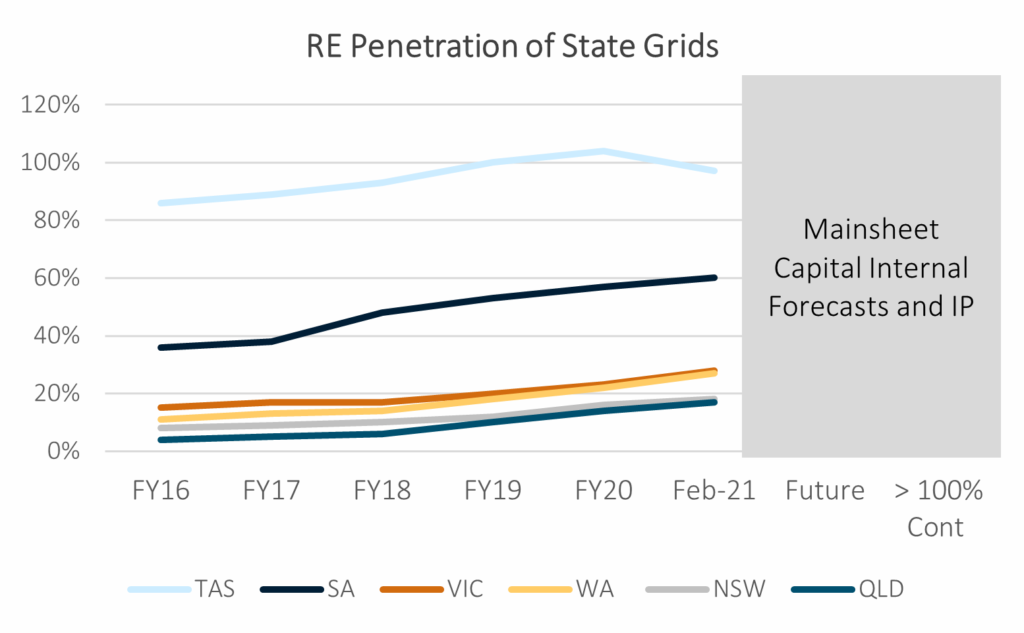
This chart shows the trends in the Renewable Energy (RE) penetration across six Australian grids. Each state is rapidly incorporating additional RE generation with a large pipeline of green projects planned, committed and under construction. This is further compounded by growth in rooftop solar generation. Our forecast year to exceed 100% RE penetration varies across states. This combined with the shape of generation curves are key elements in determining the effectiveness of strategies to reduce emissions or energy costs.
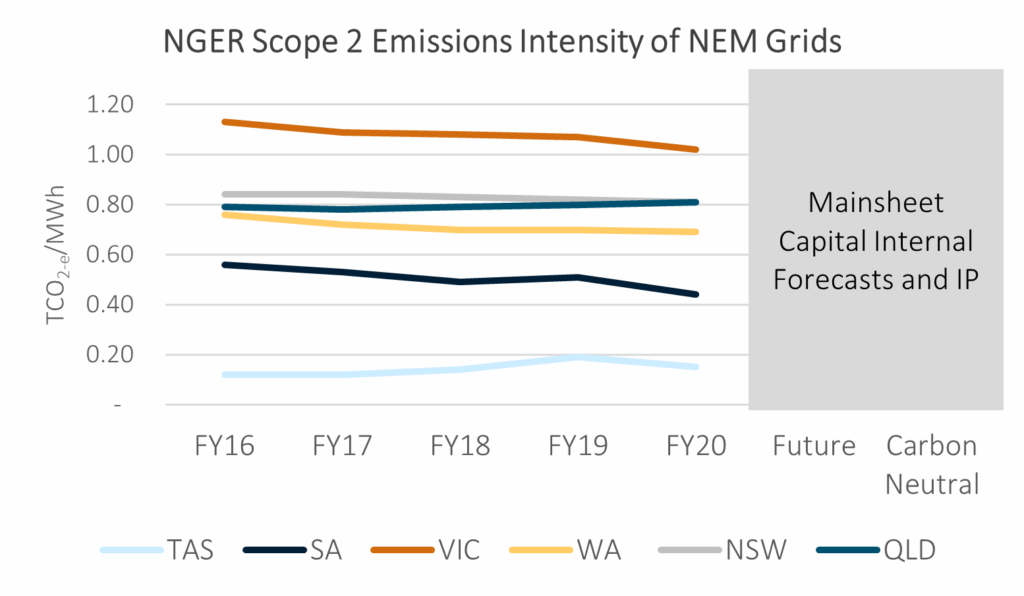
This chart shows the Scope 2 emissions intensity factors associated with energy consumption across six Australian grids. The grids with the lowest emissions intensity factor have the highest portion of RE penetration occurring. TAS and SA have the lowest emissions intensity factor due to their high RE penetration. VIC has a higher emissions intensity factor than NSW and QLD, due to its reliance on brown coal, which makes up ~75% of its CY20 generation.
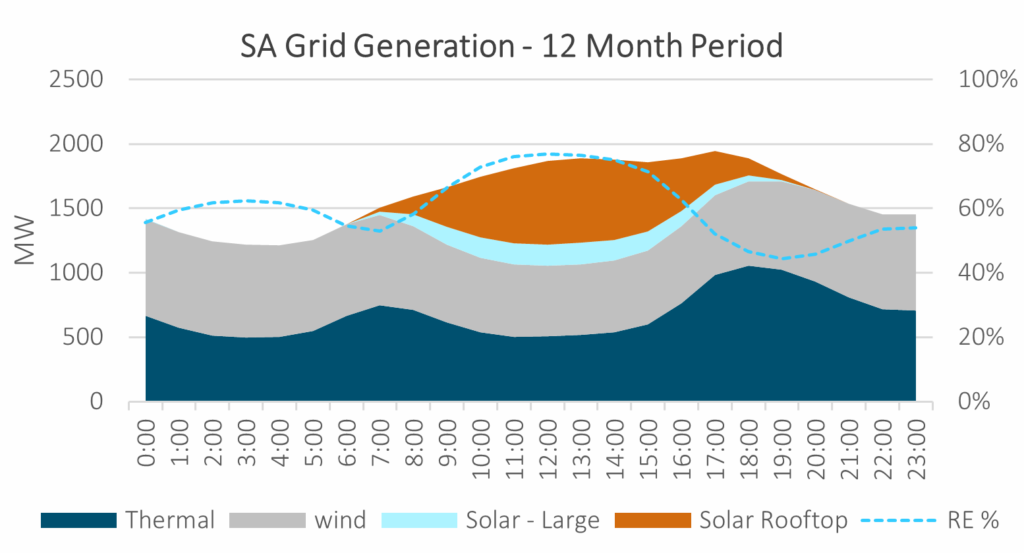
This chart depicts the generation mix of the South Australian Grid over a typical 24-hour period. The overall RE % levels vary throughout the day which the highest penetration occurring during the period of highest solar output. We refer to this as the ŌĆśshapeŌĆÖ of the grid. We incorporate this and the future curve shape as a key input to evaluate the compatibility and effectiveness of any action designed to reduce emissions or energy costs.
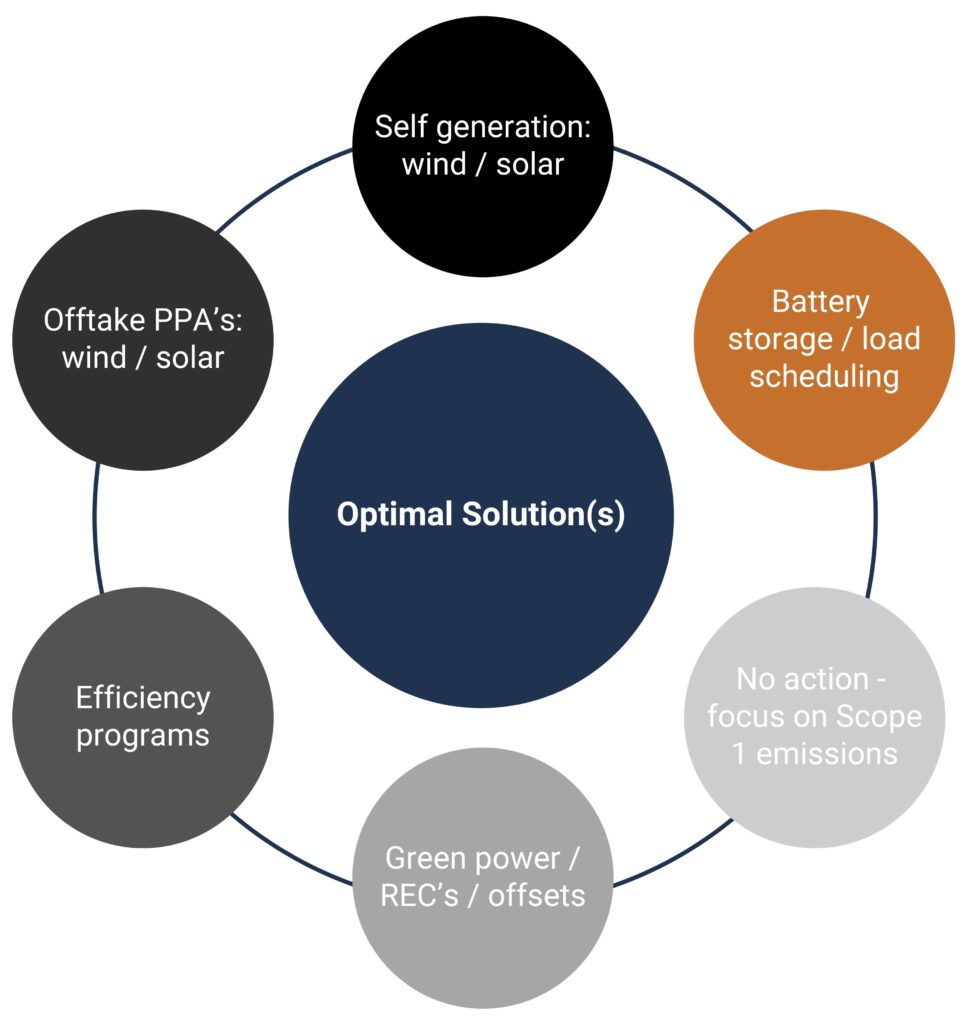
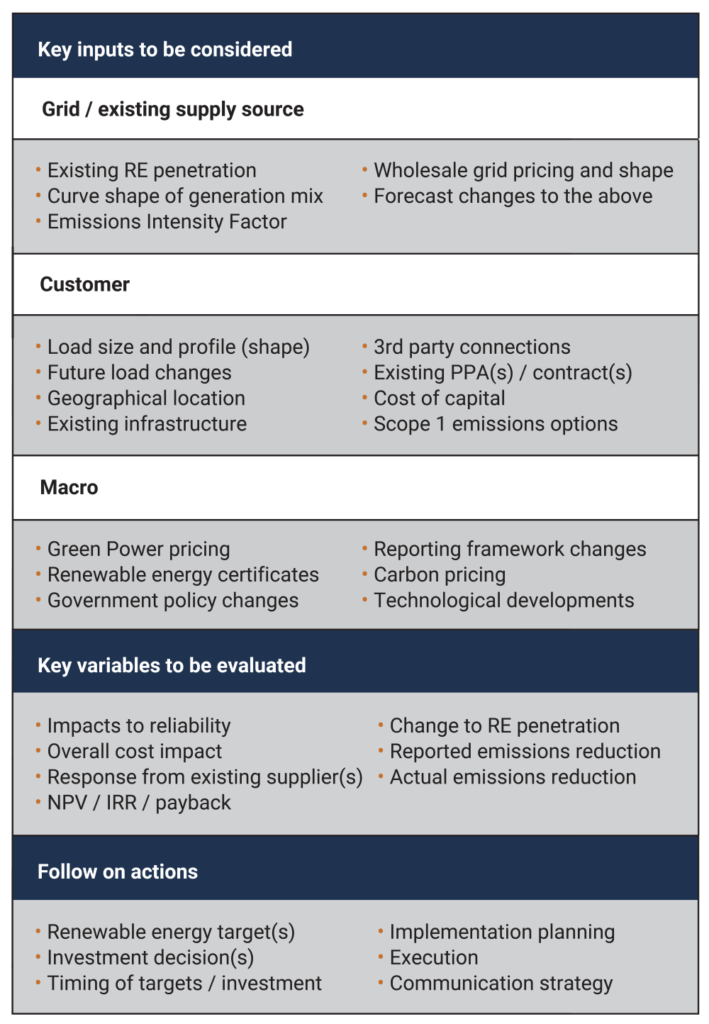
Mainsheet Capital Approach ŌĆō Electricity Costs & Scope 2 Emissions
Our approach considers a wide range of inputs to evaluate the effectiveness and expected impacts of solution(s) designed to reduce energy costs and Scope 2 emissions. This approach enables identification and implementation of optimal solutions for each client.
Mainsheet has considerable experience of supporting clients to consider a wide range of inputs to evaluate the effectiveness and expected impacts of solutions to reduce energy costs and Scope 2 emissions. If you would like to discuss this approach or your strategic planning needs then please contact us here.