M&A Performance in Australia
Why is there consistent underperformance post-acquisition?
Following our June 2019 report on the performance of M&A in Australia, we have reviewed 149 acquisitions throughout Australia that were completed during CY2018. We review transaction performance a year post-deal.
We found that 72% of acquirers underperformed the benchmark, (ASX300), one year from the closing date of their respective acquisition. In addition to the overall findings, we reviewed the impact of strategic rationale, relative size, and deal frequency in CY2018 on whether the acquirer outperformed the ASX300.1
We also examined the two-year share price performance of 60 firms that completed acquisitions in CY2017.Overall, we found that median return decreased from 6% in the first year to -3% in the second year.
Strategic Rationale
We reviewed company reports and press releases associated with each of these transactions and grouped the strategic rationale into one of five categories. Consistent with the findings reported in our previous study, companies that pursued transactions to acquire products and services were least likely to outperform the index. However, all categories underperformed the market benchmark.
DEAL RATIONALE AND SUBSEQUENT SHARE PERFORMANCE AGAINST ASX300
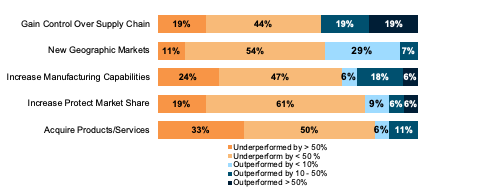
Source: CapitalIQ and Mainsheet analysis, Jan 2020. Note: 1We did not include mining acquisitions (eg. usually acquisitions of mining assets) in our analysis yet the benchmark used, the ASX300, reflects the market performance of all industries, including mining.
The data is insufficient to make judgements on the impact of strategic rationale on the success of an acquisition, but it raises several questions:
- Does acquiring new products and services present challenges to a management team possibly unfamiliar with those new operations?
- Does expanding control along the supply chain boost cooperation, and increase efficiency?
- Whilst the majority of companies pursue transactions to increase market share, are firms able to correctly identify targets that will guide them towards success?
Relative Size
We measured relative size as the size of the transaction value relative to the market capitalisation of the acquiring firm. We found that, those that were engaged in larger transactions were more likely to outperform the benchmark.
RELATIVE SIZE AND SUBSEQUENT SHARE PERFORMANCE AGAINST ASX30
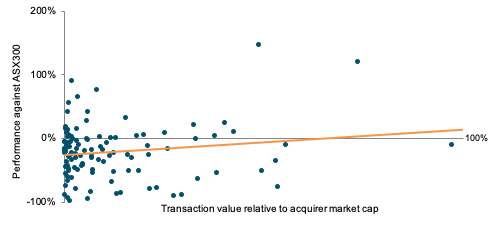
Source: CapitalIQ, DatAnalysis and Mainsheet Capital analysis, Jan 2020. * Note – 3 deals where the value of the acquirer was larger has been removed
Observations, in addition to the majority of companies underperforming the market benchmark include:
- 103 deals of the 121 deals occurred where the target was less than 30% of the value of the acquirer. In that data set less than 25% of the deals performed better than the ASX300 performance. So relatively small deals for acquirers underperformed. It could be concluded that smaller deals had a lower impact on overall performance, if all other circumstances remained constant, which we were not able to assess.
- For the 18 deals where the target was greater than 30% of the acquirer size, 44% of the deals outperformed the ASX300.
- Greater performance associated with larger relative size deals could reflect the greater alignment of governance and management approaches of similar size parties.
Deal Frequency in the Year
We reviewed the number of deals in which companies performed acquisitions during CY2018 and found that most companies underperformed the index for both a single transaction and multiple transactions in the year. However, companies were more likely to out-perform the index if they had completed multiple acquisitions. This suggests that M&A and integration are critical business competencies, where experience makes a difference.
DEALS IN THE YEAR AND SUBSEQUENT SHARE PERFORMANCE AGAINST ASX300
Source: CapitalIQ and Mainsheet analysis, Jan 2020
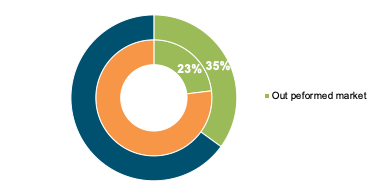
Two-Year Performance
We examined the 2-year performance of 60 acquisitions that were finalised during CY2017 and reviewed their share price performance across the following two-year period. Overall, we found that the median return decreased from 6% in the first year to -3% in the second year. If a company’s share price increased in the first year its’ share price tended to decrease in the second year.
SHARE PERFORMANCE ACROSS TWO YEARS
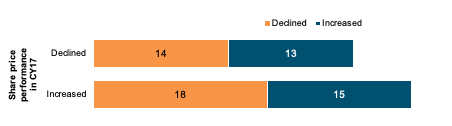
Source: CapitalIQ and Mainsheet analysis, Jan 2020
The data from the two-year period raises several questions:
- Are firms able to retain key employees following the transition?
- Does performance in the year following acquisition predict future performance?
DEAL RATIONALE AND SUBSEQUENT 2 YEAR SHARE PERFORMANCE
| Strategic Rationale | Median % change | per year |
| 1st year | 2nd year | |
| Acquire new products | 2% | -11% |
| Gain control over supply chain | 22% | 12% |
| Increase manufacturing capabilities | 13% | 5% |
| Increase market share | 28% | 11% |
| New geographic markets | 14% | -12% |
Source: CapitalIQ and Mainsheet analysis, Jan 2020
Final Comments
Integration is a dynamic and time-intensive exercise that strains management’s capacity to run the business while also leading the integration. It is also a practiced skill, like any competency, that needs focus and development if acquisitions are a core part of a company’s strategy.
Recognition
The Mainsheet Directors would like to recognise and thank Hazel Dutton and Jackson Clarke for their work on this analysis.
If you want to talk about these or other questions, please contact us here.
Mainsheet, a consulting and advisory firm in Sydney,
is currently engaged in three M&A integration projects
across a number of industries and look forward to
supporting companies outperform their peers in value creation through transactions.